Vibration Isolation System
| Reference No | SO-5967 |
| Report | Vibration Measurement & Analysis for the Optical, Honeycomb Table |
| Location | Opto Electronics (P) Limited, Industrial Estate, 1st Stage, Peenya, Bangalore |
Summary |
The scope of work involves:
|
Project Team |
|
Introduction
M/s. Optoelectronics is a Bangalore based company involved in design and development of Electronics subsystems for space and defense application. They also undertake micro controller and microprocessor based application for industrial automation and sub-modules developments. The product list of optoelectronics includes Prism Table, Lens Holder, Optical Tables, Positioning Stages and Jacks etc.
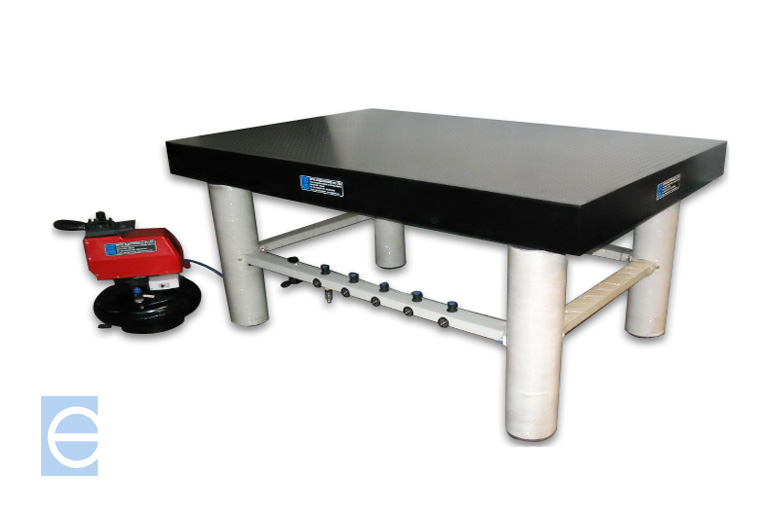
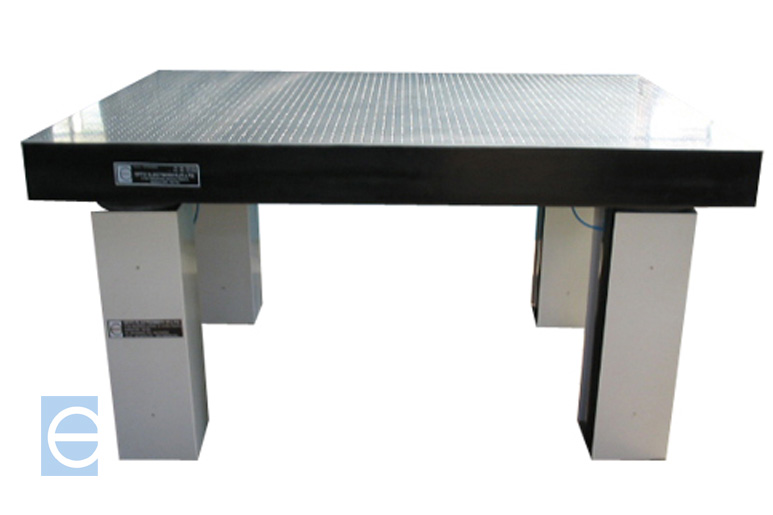
One of the major products is the Honeycomb Table Vibration Isolation System whose specifications are as follows:
| Size | 2 m x 1 m x 0.15 m |
| Top Plate | Stainless Steel 304 |
| Thickness | 6 mm |
| Core | Aluminium |
| Bottom Plate | Aluminium |
| Thickness | 3 mm |
| Side Channels | Aluminium |
| Surface Accuracy | 0.250 mm for 1 meter square area |
| Finish | Brushed Matt |
| Holes | M6 at a center distance of 25 mm |
M/s. Optoelectronics approached M/s. Foretek to carryout the Vibration Measurement on the Honeycomb Table and do the Compliance Measurement and Transmissibility Analysis in order to find out the Vibration Reduction characteristics of the Table.
This report contains the information on our Test set-up and Observations on our measurement and analysis.
Instrumentation
The following instruments/software was used to carry out the measurements:
Test Procedure
i) Measurement of Rigid Body Modes
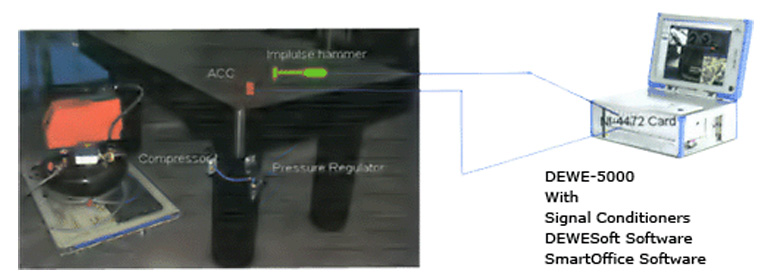
The accelerometer was mounted on the Table Top. An Impulse Hammer, Which has a force transducer, was used to excite the structure in Vertical Direction. The Teflon hammer tip was used to get the lower frequency excitation energy. The Frequency Response Function (FRF) was measured at the drive point (the location where excitation point and response point coincides) and the rigid body modes were calculated. The test is repeated for various pressure conditions such as 0.5 Bar. 1 Bar and 2 Bar. Later, the measurement was carried out with a mass of 250 kg at 2 bar Air Pressure.
Also it was measured for the Horizontal direction.
ii) Compliance Measurement
The compliance has to be calculated for the first elastic mode. The accelerometer was mounted on the Table Top. An Impulse Hammer, which has a force transducer, was used to excite the structure in Vertical Direction. The Teflon hammer tip was used to get the lower frequency (0-700Hz) excitation energy. The frequency Response Function was measured at different points of the table like centre, Corner points etc. The Compliance was extracted using the Calculator functions available in the SmartOffice Software.
The compliance calculation was carried out for a pressure setting of 1 Bar.
iii) Transmissibility Measurement
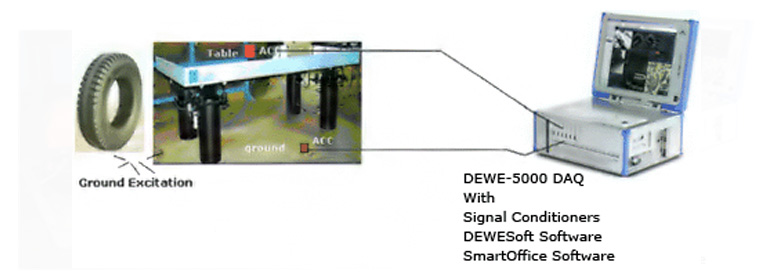
The reference accelerometer is mounted on the ground and the other accelerometer on the table top. Both the accelerometers (in vertical direction) are connected to the DEWETRON Data Acquisition System Through the signal Conditioners. The ground is excited using the drop of an automotive tyre and the transmissibility is measured through DEWE - 5000 and SmartOffice Software.
The transmissibility is calculated for 0.5 Bar, 1 Bar and 2 bar respectively.
Observations
i) Measurement of Rigid Body Modes
| Table - I: Rigid Body Modes in Vertical Direction | |
| Condition | Rigid Modal Frequency (in Hz)At Drive Point |
| 2 Bar with Load (250 Kg) | 4.5 |
| 2 Bar | 7.75 |
| 1 Bar | 7.00 |
| 0.5 Bar | 5.75 |
| Table - II: Rigid Body Modes inHorizontal Direction | |
| Condition | Rigid Modal Frequency (in Hz)At Drive Point |
| 2 Bar | 7.00 |
| 1 Bar | 6.50 |
| 0.5 Bar | 6.25 |

Fig 4: FRFs at the Drive-Point for each condition in Horizontal Direction
We have observed that the rigid body modal frequencies were decreasing with the decrease in the pressure in both Horizontal and Vertical Direction. Also it was further by addition of the weight.
ii) Compliance Measurement
| Table - III: Compliance values of the Table | ||
| Condition | Resonance Frequency in Hz | Compliance in 10-8m/n |
| Centre of the table | 217.50 | 10.72 |
| Right Corner of the table | 197.50 | 12.48 |
| Left Corner of the table | 197.50 | 13.06 |
iii) Transmissibility Measurement
The following are the transmissibility curves for various pressure condition
From all the above transmissibility curves, it is observed that:
- The amplification factor of the order of 10 and 4 occurs at 12.75 and 8.25 Hz respectively for 0.5 Bar.
- The amplification factor of the order of 9 and 3 occurs at 10.75 and 13 Hz respectively for 1 Bar.
- Isolation is effective beyond 16 Hz for 0.5 Bar and 1 Bar condition.
- For 2 Bar Condition, isolation is effective beyond 35 Hz.
Conclusion
We have observed that there is amplification occurs at the resonant frequencies but beyond 16 Hz, the vibration isolation is taking place from ground to Table which means the Honeycomb table is working fine


